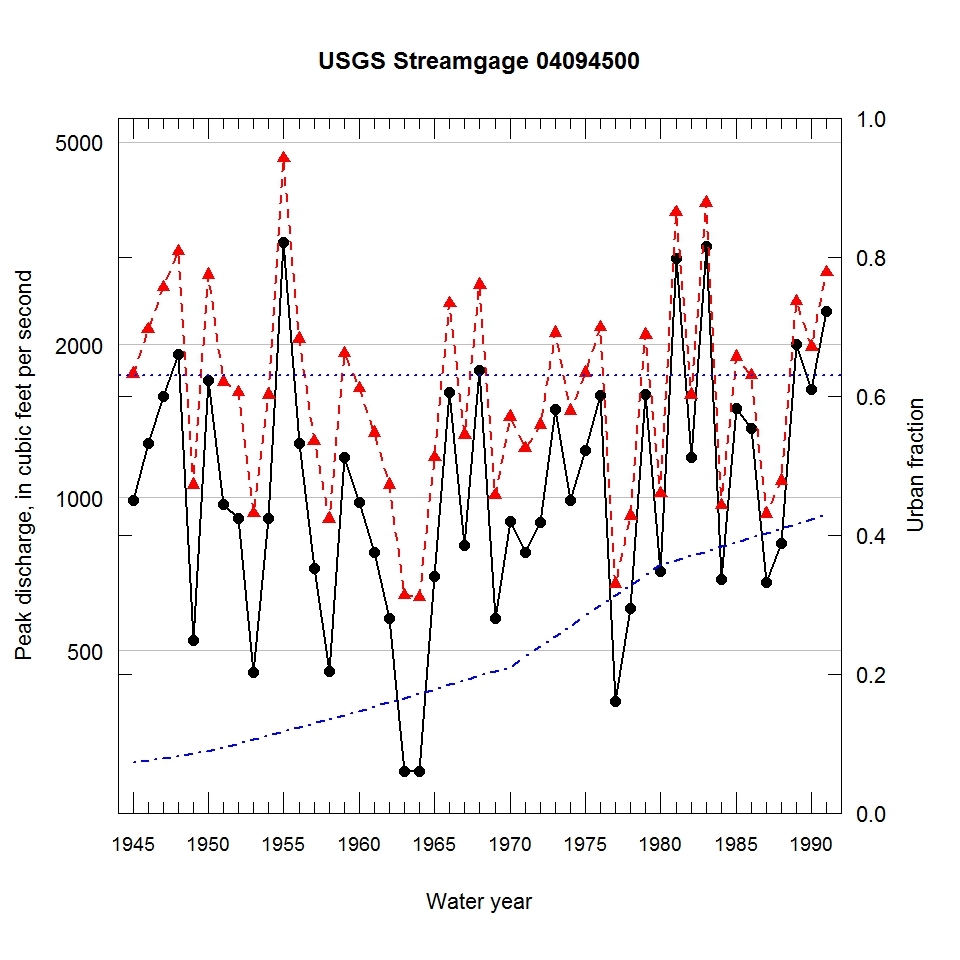
Observed and urbanization-adjusted annual maximum peak discharge and associated urban fraction and precipitation values at USGS streamgage:
04094500 SALT CREEK NEAR MCCOOL, IND.


| Water year | Segment | Discharge code | Cumulative reservoir storage (acre-feet) | Urban fraction | Precipitation (inches) | Observed peak discharge (ft3/s) | Adjusted peak discharge (ft3/s) | Exceedance probability |
| 1945 | 1 | -- | 842 | 0.073 | 1.525 | 990 | 1750 | 0.319 |
| 1946 | 1 | -- | 842 | 0.076 | 1.983 | 1280 | 2140 | 0.174 |
| 1947 | 1 | -- | 842 | 0.079 | 1.936 | 1580 | 2590 | 0.093 |
| 1948 | 1 | -- | 842 | 0.082 | 2.299 | 1910 | 3050 | 0.055 |
| 1949 | 1 | -- | 842 | 0.085 | 0.761 | 525 | 1060 | 0.740 |
| 1950 | 1 | -- | 842 | 0.088 | 1.676 | 1700 | 2740 | 0.076 |
| 1951 | 1 | -- | 842 | 0.094 | 2.394 | 970 | 1690 | 0.346 |
| 1952 | 1 | -- | 842 | 0.100 | 0.642 | 912 | 1610 | 0.390 |
| 1953 | 1 | -- | 842 | 0.106 | 0.469 | 454 | 931 | 0.810 |
| 1954 | 1 | -- | 842 | 0.111 | 1.719 | 910 | 1590 | 0.399 |
| 1955 | 1 | -- | 842 | 0.117 | 4.644 | 3180 | 4640 | 0.014 |
| 1956 | 1 | -- | 842 | 0.123 | 2.195 | 1280 | 2050 | 0.193 |
| 1957 | 1 | -- | 842 | 0.129 | 0.821 | 725 | 1290 | 0.584 |
| 1958 | 1 | -- | 842 | 0.135 | 1.304 | 456 | 908 | 0.824 |
| 1959 | 1 | -- | 842 | 0.141 | 2.209 | 1200 | 1920 | 0.239 |
| 1960 | 1 | 2 | 842 | 0.146 | 0.826 | 980 | 1640 | 0.375 |
| 1961 | 1 | -- | 842 | 0.153 | 1.320 | 780 | 1340 | 0.548 |
| 1962 | 1 | -- | 842 | 0.159 | 0.333 | 578 | 1060 | 0.739 |
| 1963 | 1 | -- | 842 | 0.166 | 1.263 | 290 | 642 | 0.936 |
| 1964 | 1 | -- | 842 | 0.172 | 0.665 | 290 | 637 | 0.937 |
| 1965 | 1 | -- | 842 | 0.178 | 1.037 | 700 | 1200 | 0.643 |
| 1966 | 1 | -- | 842 | 0.185 | 2.414 | 1610 | 2410 | 0.121 |
| 1967 | 1 | -- | 842 | 0.191 | 1.226 | 805 | 1330 | 0.558 |
| 1968 | 1 | -- | 842 | 0.197 | 1.534 | 1780 | 2620 | 0.089 |
| 1969 | 1 | -- | 842 | 0.204 | 0.583 | 578 | 1010 | 0.765 |
| 1970 | 1 | -- | 842 | 0.210 | 1.899 | 900 | 1440 | 0.488 |
| 1971 | 1 | 18 | 842 | 0.225 | 0.538 | 780 | 1250 | 0.611 |
| 1972 | 1 | -- | 842 | 0.240 | 2.669 | 894 | 1390 | 0.519 |
| 1973 | 1 | -- | 842 | 0.254 | 1.668 | 1490 | 2110 | 0.181 |
| 1974 | 1 | -- | 1565 | 0.269 | 0.874 | 989 | 1480 | 0.466 |
| 1975 | 1 | -- | 1565 | 0.284 | 1.753 | 1240 | 1760 | 0.309 |
| 1976 | 1 | -- | 1565 | 0.298 | 1.056 | 1590 | 2160 | 0.171 |
| 1977 | 1 | -- | 1565 | 0.313 | 1.120 | 398 | 676 | 0.928 |
| 1978 | 1 | -- | 1565 | 0.328 | 0.233 | 606 | 920 | 0.817 |
| 1979 | 1 | -- | 1565 | 0.342 | 0.836 | 1600 | 2090 | 0.186 |
| 1980 | 1 | -- | 1565 | 0.357 | 0.495 | 716 | 1020 | 0.759 |
| 1981 | 1 | -- | 1565 | 0.364 | 3.820 | 2950 | 3640 | 0.029 |
| 1982 | 1 | 2 | 1565 | 0.370 | 0.452 | 1200 | 1590 | 0.402 |
| 1983 | 1 | -- | 1565 | 0.377 | 4.778 | 3120 | 3800 | 0.024 |
| 1984 | 1 | -- | 1565 | 0.383 | 1.511 | 692 | 965 | 0.791 |
| 1985 | 1 | -- | 1565 | 0.390 | 1.306 | 1500 | 1890 | 0.249 |
| 1986 | 1 | -- | 1565 | 0.396 | 2.026 | 1370 | 1740 | 0.319 |
| 1987 | 1 | -- | 1565 | 0.403 | 1.394 | 681 | 930 | 0.811 |
| 1988 | 1 | -- | 1565 | 0.409 | 1.240 | 815 | 1080 | 0.725 |
| 1989 | 1 | -- | 1565 | 0.416 | 2.970 | 2000 | 2430 | 0.119 |
| 1990 | 1 | -- | 1565 | 0.422 | 3.635 | 1630 | 1980 | 0.216 |
| 1991 | 1 | -- | 1565 | 0.430 | 2.861 | 2320 | 2770 | 0.073 |

